Kp-index
Kp-index forecast
| Min. | Max. | |
|---|---|---|
| Friday | Kp1 | Kp2- |
| Saturday | Kp2 | Kp4 |
| Sunday | Kp3 | Kp5 |
Real Time Solar Wind
With the current speed, it will take the solar wind 68 minutes to propagate from ACE to Earth.
Solar wind
Speed: 370.03 km/sec
Density: 6.55 p/cm3
Interplanetary Magnetic Field
Bt: 9.28 nT
Bz: -2.56 nT South
Info More data
Sunspot regions
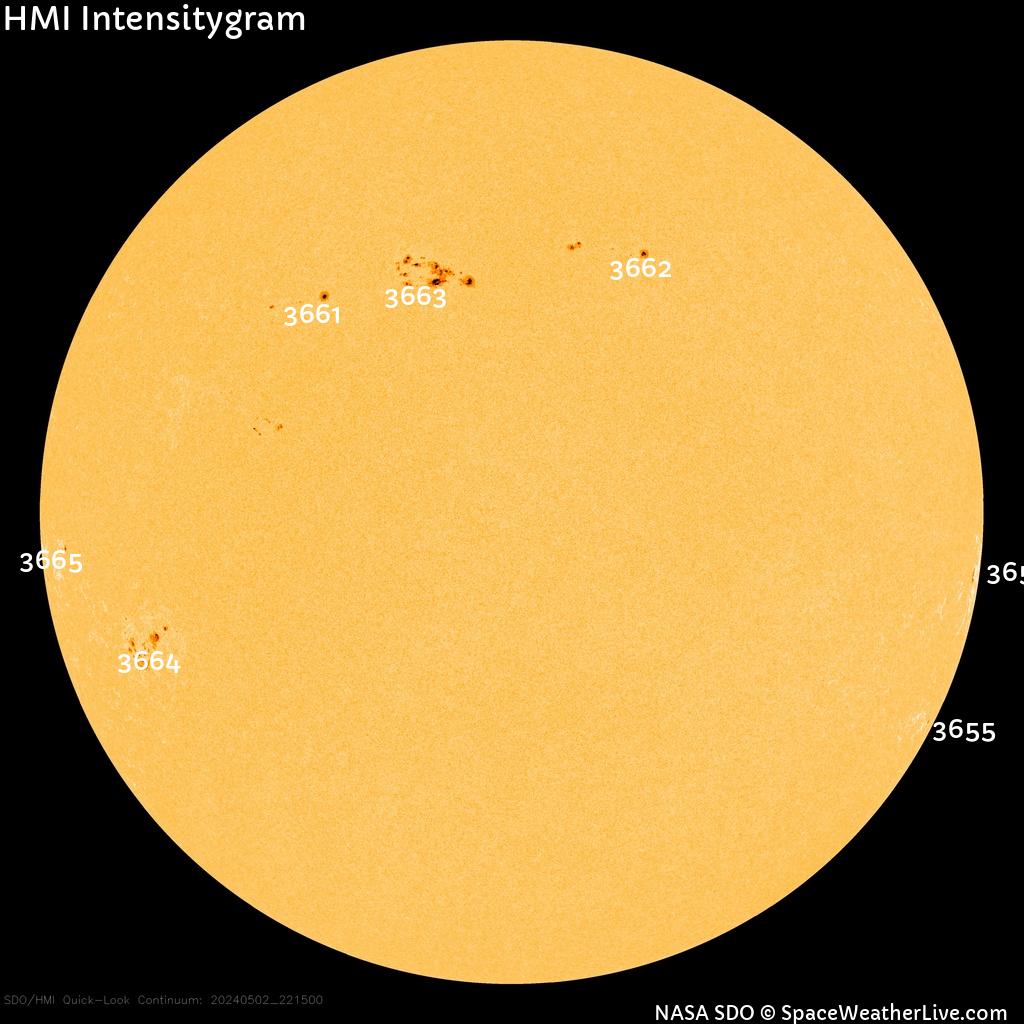
Sunspot regions
Today's Sun
| Sunspot number | 87 | 20 |
| New regions | 2 | 2 |
| 10.7cm Solar Radio Flux | 122 | 2 |
| Carrington Rotation | 2303 | |
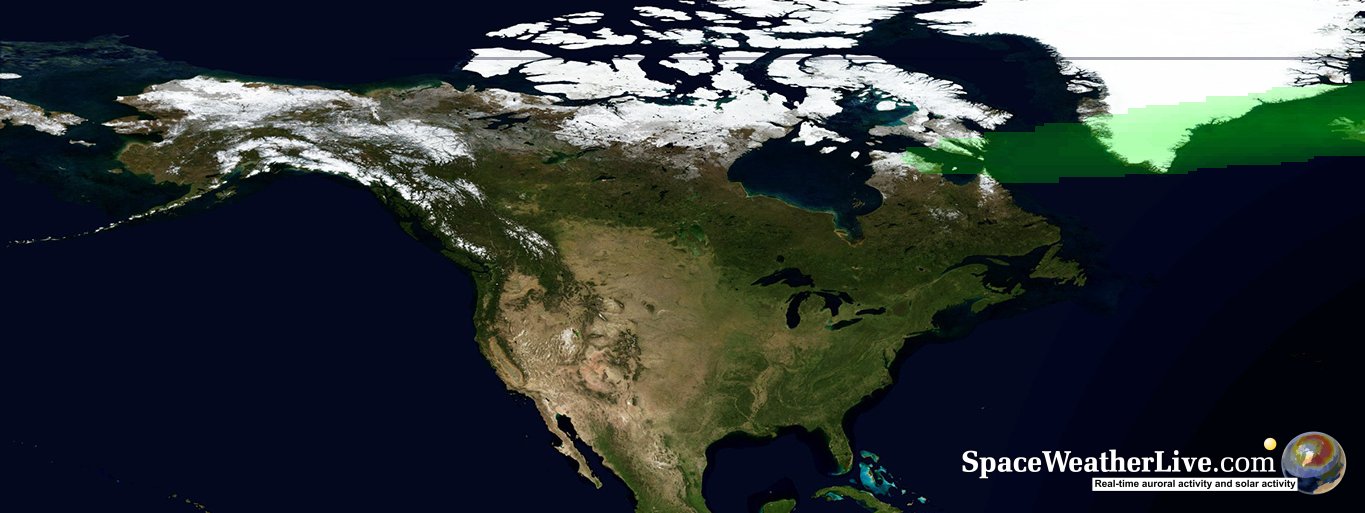
Current data suggests there is a slight possibility for aurora to appear at the following high latitude regions in the near future
Norilsk, VorkutaLatest news

Thursday, 11 September 2025
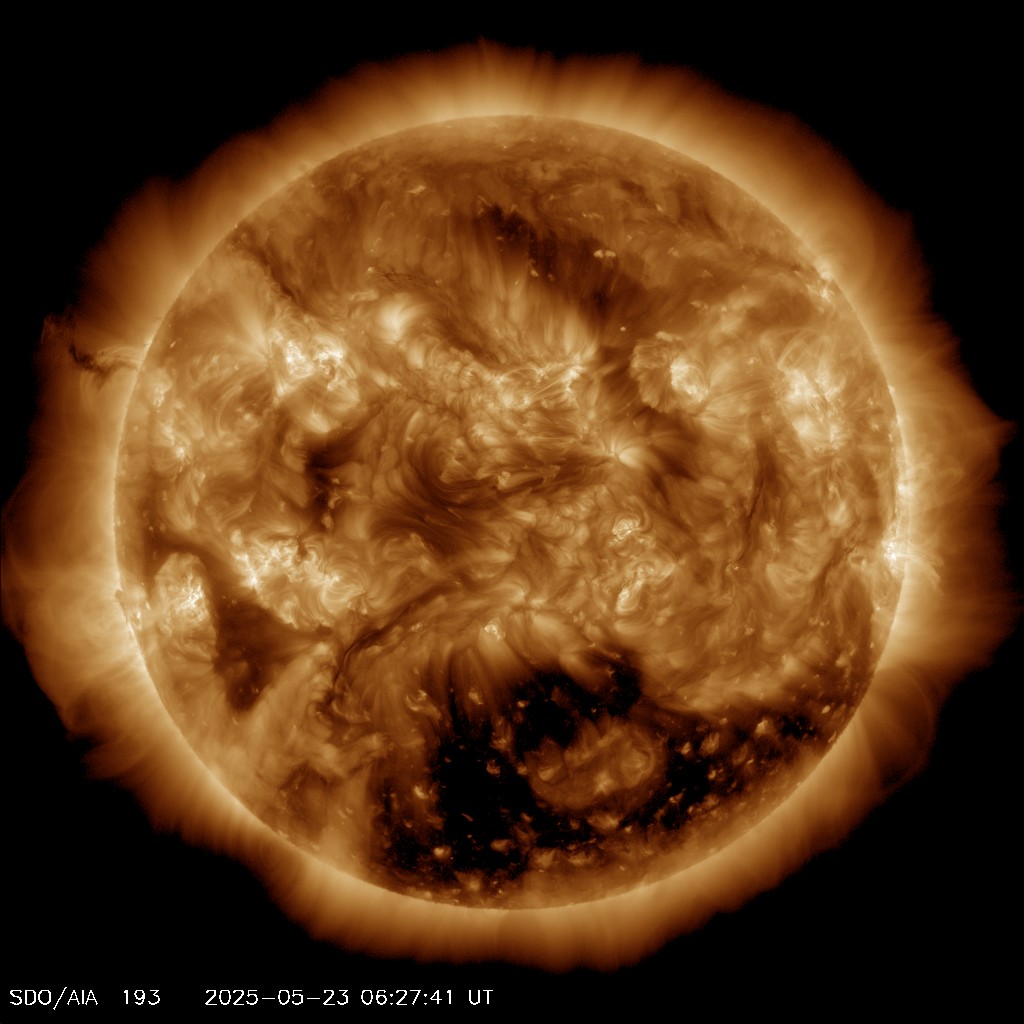
Coronal hole faces Earth

Sunday, 31 August 2025
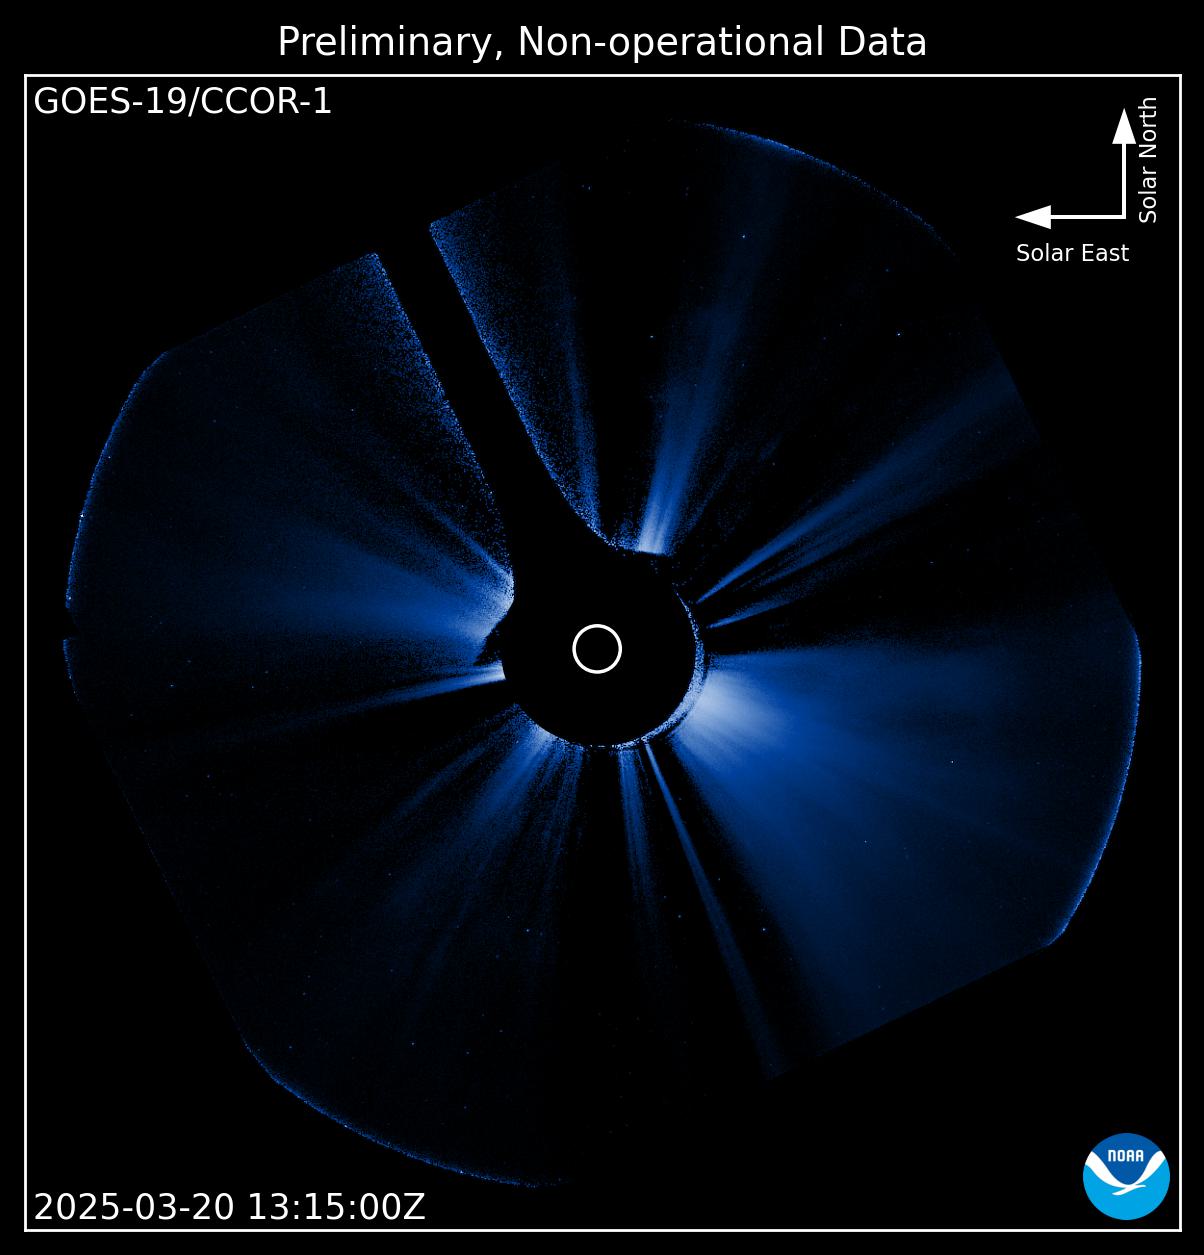
M2.7 solar flare with earth-directed CME!

Tuesday, 5 August 2025
M4.4 solar flare from sunspot region 4168
Latest forum messages
Incoming & Unnumbered Active Regions 2113Forum messages 3Coronal Hole 85 29Comet C/2025 A6 (Lemmon) 75Unspecified geomagnetic activity 3211
More topicsSupport SpaceWeatherLive.com!
A lot of people come to SpaceWeatherLive to follow the Solar activity or if there is a chance to see the aurora, but with more traffic comes higher costs to keep the servers online. If you like SpaceWeatherLive and want to support the project you can choose a subscription for an ad-free site or consider a donation. With your help we can keep SpaceWeatherLive online!


Latest alerts
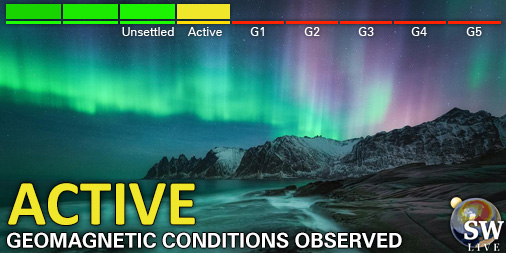
04:15 UTC - Geomagnetic activity
Active geomagnetic conditions (Kp4) Threshold Reached: 02:59 UTC
Thursday, 9 October 2025
12:51 UTC - Solar flare
Moderate M2.02 flare

12:30 UTC - Radio Blackout
Minor R1 radio blackout in progress (≥M1 - current: M1.35)
03:55 UTC - Coronal hole
A transequatorial coronal hole is facing Earth. Enhanced solar wind could arrive in ~3 days

Space weather facts
| Last X-flare | 2025/06/19 | X1.9 |
| Last M-flare | 2025/10/09 | M2.0 |
| Last geomagnetic storm | 2025/10/03 | Kp5 (G1) |
| Spotless days | |
|---|---|
| Last spotless day | 2022/06/08 |
| Monthly mean Sunspot Number | |
|---|---|
| September 2025 | 129.8 -3.7 |
| October 2025 | 126.1 -3.7 |
| Last 30 days | 130 +0.6 |