Najczęściej zadawane pytania (FAQ)

Jednym z najważniejszych zadań, które mamy tu na SpaceWeatherLive jest to, że nasi goście dowiedzieć się o kosmicznej pogody, gdy odwiedzają naszą stronę internetową. To jest właśnie powód, dla którego mamy dużą część pomocy z wielu artykułów, gdzie kopać głębiej w świecie pogody kosmicznej. Jednak nadal otrzymaliśmy wiele pytań są na SpaceWeatherLive a niektóre z tych pytań wrócić tak często. Pytania, które otrzymaliśmy najczęściej można teraz znaleźć w tym FAQ.

Aktywność słoneczna

Nie wiemy. Są ludzie lub nawet naukowcy, którzy twierdzą, że słońce zmierza w kierunku nowego minimum Maundera. Minimum Maundera jest okresem, który trwa około 70 lat między 1645 a 1715, kiedy bardzo mało plam słonecznych było widocznych na tarczy słonecznej. Prawdą jest, że cykl słoneczny 24 był mniej aktywny niż było przewidywano dekade temu, nie wiemy jeszcze jak celnie przewidzieć aktywność słoneczną z tak dużym wyprzedzeniem. Nie może być powiedziane czy słońce wchodzi w długotrwający okres nadzwyczajnej ciszy. W czasie pisania tego, przewidywne jest że cykl słoneczny 25 będzie tak samo silny lub silniejszy niż cykl słoneczny 24.

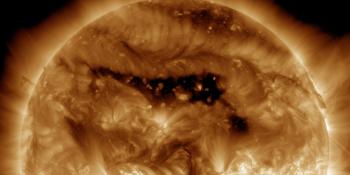
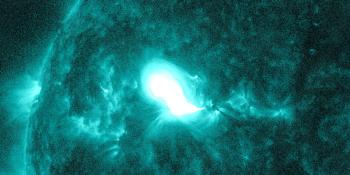
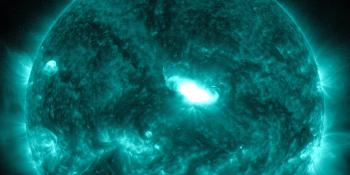
Rozbłyski słoneczne mogą się nie tylko drastycznie różnić siłą, ale także czasem trwania. Niektóre rozbłyski słoneczne trwają godzinami, a inne tylko kilka minut. Długotrwałe rozbłyski słoneczne są często (ale nie zawsze!) połączone z wyrzutem plazmy słonecznej. To jest to, co nazywamy wyrzutem masy koronalnej. Rozbłyski słoneczne, które nie trwają zbyt długo (impulsywne), nadal mogą wywołać wyrzut masy koronalnej, ale jest to dość rzadkie, a jeśli już, to te wyrzuty masy koronalnej często nie są tak silne, jak wyrzuty masy koronalnej, które są wywoływane podczas zdarzeń o długim czasie trwania.

Nie ma dokładnego limitu czasu, jaki musi trwać rozbłysk słoneczny, aby można go było zakwalifikować jako zjawisko długotrwałe, ale amerykańska NOAA SWPC klasyfikuje rozbłysk słoneczny jako zjawisko długotrwałe, jeśli nie upłynął jeszcze 30 minut od jego rozpoczęcia.

Image: Example of an impulsive solar flare.

Image: Example of a long duration solar flare.

During solar eruptions, the Sun often emits large amounts of protons and electrons. These protons are flung out in all directions but a good bit of them follow the magnetic field lines of the interplanetary magnetic field. Because the Sun spins on her own axis, the interplanetary magnetic field forms a shape which you could compare to ballerina’s skirt. This is what we call the Parker spiral. Because of the Parker spiral, protons launched from areas near or even behind the west limb can reach Earth.

Obraz: The Parker Spiral.

NASA’s Solar Dynamics Observatory is in a geosynchronous orbit around our planet. From there it normally has an uninterrupted view of the Sun. However, twice a year near the equinoxes the Earth blocks SDO’s view of the Sun for a period of time each day. These eclipses are fairly short near the beginning and end of these three week eclipse seasons but ramp up to 72 minutes in the middle. If you see an image from SDO that is completely black then you are likely looking at Earth!

Sometimes you might be lucky enough to see a much smaller object on the images from NASA’s Solar Dynamics Observatory: the Moon! The Moon can also appear on images from NASA’s Solar Dynamics Observatory but it will never block the entire Sun for a very long time like Earth does.

Animation: The Earth blocks SDO’s view of the Sun.

Animation: The Moon blocks SDO’s view of the Sun.

Just like SDO, some data dropouts will occur during satellite eclipses when the Moon or Earth comes between the satellite and the Sun. This is especially common during the spring and fall. The eclipse season lasts for about 45 to 60 days and the data dropouts ranges from minutes to just over an hour.
Solar flares are basically intense but very localized explosions on our Sun which emit a lot of electromagnetic radiation in Ultraviolet and X-rays. Solar flares normally do not emit electromagnetic radiation in the visible spectrum (which we experience as light) but on very rare occasions solar flares can emit light in the visible spectrum as well. When this occurs, we call a solar flare a white-light solar flare. This is a rare occurrence and it is still not fully understood. White-light solar flares are often among the strongest solar flares ever observed. However, the amount of visible light emitted by a white-light solar flare is minuscule compared to the brightness of the Sun itself so don’t expect to see the Sun getting visibly brighter while standing on Earth when a white-light solar flare occurs!

To determine the magnetic polarity of sunspots and a sunspot group’s magnetic classification we use magnetogram imagery from the SDO/HMI instrument. This is a line-of-sight magnetogram even though the magnetic field of the Sun is 3D. This makes it impossible to accurately determine a sunspot region’s magnetic layout near the limbs due to projection effect as the polarity of sunspots seem to change near the limbs.

Image: Projection effect.

Nie. Prawie każdy z koronalnych wyrzutów koronalnych, które docierają na ziemie nie sprawiają żadnych godnych uwagi problemów. Chociaż prawdą jest, że bardzo silne koronalne wyrzuty masy mogą spowodować liczne problemy z naszą współczesną technologią jak satelity oraz linie energetyczne wysokiego napięcia, jesteśmy bardziej przygotowani na takie wydarzenia teraz niż byliśmy dekade temu. Sławna haloweenowa burza słoneczna z 2003 była najmocniejszą burzą geomagnetyczną w wspołczesnej historii i kiedy ta burza geomagnetyczna spowodowała niewielkie problemy jak (tymczasowa) strata satelit i krótkie przerwy w dostawie prądu w południowej Szwecji, nie powinniśmy się martwić, że burza słoneczna, nieważne jak silna, mogłaby cofnąć nas do ciemnych wieków.

Difference images are created by subtracting one image from the foregoing picture. This shows what has changed from one frame to the other and are commonly used when analyzing solar events. Coronal mass ejections and their exact trajectory can sometimes be hard to spot using regular imagery making difference imagery often an invaluable tool. Solar eruptions are also much easier to spot and analyze with difference imagery.

Animation: Difference imagery from SDO of an eruption in 2015.

Animation: Difference imagery from SOHO/LASCO of a coronal mass ejection in 2017.

No they do not. Active regions only receive a number when they are on the Earth-facing solar disk and only if they are accompanied by sunspots. We also can not see with the help of the STEREO satellites if an active region on the far side of the Sun has sunspots or not. STEREO is only able to see the Sun in extreme ultraviolet light which does not make it possible to see if an active region contains any sunspots.
Yes. Active regions get numbered by NOAA once they appear on the Earth-facing solar disc but only if they are accompanied by sunspots. If an active region survives one (or sometimes more!) solar rotations it will be given multiple numbers.

Aktywność zorzowa

No. First you need to understand that a solar flare doesn’t cause aurora. Solar flares can launch large clouds of solar plasma which we call coronal mass ejections and it is these coronal mass ejections that can produce aurora when they arrive at our planet. We also need to know that not every solar flare launches a coronal mass ejection. In fact, most solar flares do not! If we do have a strong and eruptive solar flare, it also needs to come from a sunspot region that is close to the center of the Earth-facing solar disk or else there is a risk that the coronal mass ejection is launched in a direction away from Earth. While the light of a solar flare takes just 8 minutes to reach our planet, these coronal mass ejections travel at much slower speeds. Very fast coronal mass ejections can travel the Sun-Earth distance in just one day but these are very rare. Most coronal mass ejections take two to four days to arrive at Earth.
There are no accurate ways to predict hours in advance where aurora might be seen and also not at what exact time. The auroral oval is normally at its thickest around local midnight but of course the solar wind conditions at Earth also need to be favorable for aurora at your specific location. It is not impossible to see aurora early in the evening or close to morning if the solar wind conditions are favorable enough for your location. You can only accurately estimate if there will be chance for aurora at your location about 1 hour in advance. The Deep Space Climate Observatory (DSCOVR) satellite that measures the solar wind and interplanetary magnetic field parameters is located between the Sun and the Earth and it takes the solar wind anywhere from 30 minutes to about an hour to travel the distance from DSCOVR to Earth. Taking a look at the parameters measured by DSCOVR is always a great start if you wish to know if there will be a chance for aurora at your location in the near future. Want to know if there is chance at this exact moment? Then we recommend taking a look at a local magnetometer.

Any location on the high latitudes will be able to see auroras with a Kp of 4. For any location on the middle latitudes a Kp-value of 7 is needed. The low latitudes need Kp-values of 8 or 9. The Kp-value that you need of course depends on where you are located on Earth. We made a handy list which is a good guide for what Kp-value you need for any given location within the reach of the auroral ovals.

Important! Note that the locations below give you a reasonable chance to see auroras for the given Kp-index provided local viewing conditions are good. This includes but is not limited to: a clear sight towards the northern or southern horizon, no clouds, no light pollution and complete darkness.

KpWidoczne z
0

Ameryka Północna:
Barrow (AK, Stany Zjednoczone) Yellowknife (NT, Kanada) Gillam (MB, Kanada) Nuuk (Grenlandia)

Europa:
Reykjavik (Islandia) Tromsø (Norwegia) Inari (Finlandia) Kirkenes (Norwegia) Murmansk (Rosja)

1

Ameryka Północna:
Fairbanks (AK, Stany Zjednoczone) Whitehorse (YT, Kanada)

Europa:
Mo I Rana (Norwegia) Jokkmokk (Szwecja) Rovaniemi (Finlandia)

2

Ameryka Północna:
Anchorage (AK, Stany Zjednoczone) Edmonton (AB, Kanada) Saskatoon (SK, Kanada) Winnipeg (MB, Kanada)

Europa:
Tórshavn (Wyspy Owcze) Trondheim (Norwegia) Umeå (Szwecja) Kokkola (Finlandia) Arkhangelsk (Rosja)

3

Ameryka Północna:
Calgary (AB, Kanada) Thunder Bay (ON, Kanada)

Europa:
Ålesund (Norwegia) Sundsvall (Szwecja) Jyväskylä (Finlandia)

4

Ameryka Północna:
Vancouver (BC, Kanada) St. John's (NL, Kanada) Billings (MT, Stany Zjednoczone) Bismarck (ND, Stany Zjednoczone) Minneapolis (MN, Stany Zjednoczone)

Europa:
Oslo (Norwegia) Stockholm (Szwecja) Helsinki (Finlandia) Saint Petersburg (Rosja)

5

Ameryka Północna:
Seattle (WA, Stany Zjednoczone) Chicago (IL, Stany Zjednoczone) Toronto (ON, Kanada) Halifax (NS, Kanada)

Europa:
Edinburgh (Scotland) Gothenburg (Szwecja) Riga (Łotwa)

Półkula południowa:
Hobart (Australia) Invercargill (Nowa Zelandia)

6

Ameryka Północna:
Portland (OR, Stany Zjednoczone) Boise (ID, Stany Zjednoczone) Casper (WY, Stany Zjednoczone) Lincoln (NE, Stany Zjednoczone) Indianapolis (IN, Stany Zjednoczone) Columbus (OH, Stany Zjednoczone) New York City (NY, Stany Zjednoczone)

Europa:
Dublin (Irlandia) Manchester (Wielka Brytania) Hamburg (Niemcy) Gdańsk (Polska) Vilnius (Litwa) Moscow (Rosja)

Półkula południowa:
Devonport (Australia) Christchurch (Nowa Zelandia)

7

Ameryka Północna:
Salt Lake City (UT, Stany Zjednoczone) Denver (CO, Stany Zjednoczone) Nashville (TN, Stany Zjednoczone) Richmond (VA, Stany Zjednoczone)

Europa:
London (England) Brussels (Belgia) Cologne (Niemcy) Dresden (Niemcy) Warsaw (Polska)

Półkula południowa:
Melbourne (Australia) Wellington (Nowa Zelandia)

8

Ameryka Północna:
San Francisco (CA, Stany Zjednoczone) Las Vegas (NV, Stany Zjednoczone) Albuquerque (NM, Stany Zjednoczone) Dallas (TX, Stany Zjednoczone) Jackson (MS, Stany Zjednoczone) Atlanta (GA, Stany Zjednoczone)

Europa:
Paris (Francja) Munich (Niemcy) Vienna (Austria) Bratislava (Słowacja) Kiev (Ukraina)

Azja:
Astana (Kazachstan) Novosibirsk (Rosja)

Półkula południowa:
Perth (Australia) Sydney (Australia) Auckland (Nowa Zelandia)

9

Ameryka Północna:
Monterrey (Mexico) Miami (FL, Stany Zjednoczone)

Europa:
Madrid (Spain) Marseille (Francja) Rome (Włochy) Bucharest (Rumunia)

Azja:
Ulan Bator (Mongolia)

Półkula południowa:
Alice Springs (Australia) Brisbane (Australia) Ushuaia (Argentyna) Cape Town (Republika Południowej Afryki)

There can be multiple reasons for such a large difference between NOAA’s predicted Kp-index and the Kp that is being observed right now. The most common reason is that NOAA predicts that a coronal mass ejection is on its way to Earth and it was expected to arrive around that specific time. However, it can very well be that the coronal mass ejection is late and thus did not arrive yet meaning the geomagnetic conditions are still calm even though significantly more activity was expected. It is very hard to accurately predict the arrival time of a coronal mass ejection so it is not uncommon that coronal mass ejections arrive several hours after the predicted arrival time.

There is no difference between Kp5 and G1. NOAA uses a five-level system called the G-scale, to indicate the severity of both observed and predicted geomagnetic activity. This scale is used to give a quick indication of the severity of a geomagnetic storm. This scale ranges from G1 to G5, with G1 being the lowest level and G5 being the highest level. Conditions below storm level are labelled as G0 but this value is not commonly used. Every G-level has a certain Kp-value associated with it. This ranges from G1 for a Kp-value of 5 to G5 for a Kp-value of 9. The table below will help you with that.

G-scaleKpAktywność zorzowaŚrednia częstotliwość
G04 i niższePoniżej poziomu burzy
G15Słaba burza1700 na cykl (900 dni na cykl)
G26Średni burzy600 na cykl (360 dni na cykl)
G37Silna burza200 na cykl (130 dni na cykl)
G48Bardzo silna burza100 na cykl (60 dni na cykl)
G59Ekstremalne burzy4 na cykl (4 dni na cykl)
If you want to have a good chance to see aurora during your vacation you need to find a location as close as possible to the auroral oval. The auroral oval is an area around the magnetic poles of our planet where aurora occurs the most often, even during quiet space weather conditions. This oval is not equally large at all times: during strong geomagnetic activity, this oval will expand down to lower latitudes which means the aurora can be seen from lower latitudes but this of course does not occur very often. When on vacation you want to have the best chance to see aurora even during quiet space weather of course and that means you will likely need to travel north. It’s all about location! The auroral oval is located at the following locations during low geomagnetic activity. Northern hemisphere: Alaska, northern Canada, southern Greenland, Iceland, northern Norway, northern Sweden, northern Finland and northern Russia. For the southern lights you will have to go to Antarctica.
Yes. If the aurora is strong enough, then it’s absolutely still possible to see this phenomenon during a full moon. We do have to note that moonlight is quite strong compared to aurora so weak aurora might be hard or even impossible to see. Especially for lower latitudes, we really want as little moonlight as possible to increase our odds of seeing aurora.
That is actually correct. During the weeks around the equinox (astronomical event in which the plane of Earth's equator passes the center of the Sun) the aurora can be ever so slightly more active than at other times. Why this occurs isn’t fully understood yet but scientists believe that Earth’s tilt in some way favors enhanced geomagnetic conditions around the equinox.
Many cameras these days are capable of producing quality pictures of the aurora. However, there are a few things you need to think of if you are thinking of getting serious into the world of aurora photography. First you must get a camera that has a manual (M) mode. For aurora photography we want full control over the camera, as we are going to tell the camera exactly what it has to do for us. If you let the camera decide what settings it’s going to use than you will likely end up with a less than satisfying result. Second item you must get is a tripod as we are going to use slow shutter speeds. You cannot use a shutter speed of let’s say 10 seconds and hold the camera perfectly still by hand. You will move the camera even if you try your very best and come home with blurry pictures. So it’s very important to invest in a tripod! When it comes to lenses, kit lenses are often very much capable of producing nice pictures of the Aurora Borealis. If you have the money you can consider getting a wider and a faster (lower f-stop) lens so you can don’t have to expose as long but it is not vital. To reduce camera shake even more, a remote shutter release can be a very handy tool as well.
No, the Aurora Borealis and the Aurora Australis will not completely disappear during solar minimum but it's appearance will be less frequent during solar minimum. Solar minimum is a period where very few sunspots appear on the Sun. Fewer sunspots means fewer solar flares and fewer coronal mass ejections being launched towards our planet. The normal solar wind will not disappear and coronal holes will still be present from time to time but they will appear less frequently near the equator and be smaller in size. While it is true that there are less geomagnetic storms during the years around solar minimum, the aurora will still be visible from time to time at high latitudes locations. Because there aren’t as many strong solar storms during solar minimum as during solar maximum, it will not happen very often that the auroral oval expands to lower latitudes but aurora will appear from time to time at locations close to the auroral oval, like northern Scandinavia and Alaska but perhaps not as frequent as during solar maximum.
Nie. Biegunowość międzyplanetarnego pola magnetycznego i kierunki północ-południe (Bz) międzyplanetarnego pola magnetycznego są dwoma różnymi rzeczami. Prawdą jest, że mówimy tu o negatywnym Bz-, kiedy kierunki północ-południe międzyplanetarnego pola magnetycznego zmienia kierunek na południowy nie ma to w żaden sposób na biegunowość międzyplanetarnego pola magnetycznego. Biegunowość międzyplanetarnego pola magnetycznego nie jest waża jeżeli interesuje cię czy są szanse na zorzę polarną dzisiaj. Kieruneki północ-południe (Bz) międzyplanetarnego pola magnetycznego są jednak kluczowym składnikiem kiedy chodzi o aktywność zorzową ale tego się nie da przewidzieć. Kierunek północ-południe (Bz) międzyplanetarnego polar magnetycznego jest znany przedewszystkim kiedy przechodzi obok satelity DSCOVR. Stąd zajmuje wiatru słonecznego tylko od 30 do 60 minut by dotrzeć do ziemi.
Są ludzie, którzy twierdzą, że usłyszeli zorzę polarną na własne uszy podczas silnej aktywności zorzowej, ale nie ma żadnych solidnych dowodów, że zorza produkuje fale dźwiękowe, które ludzkie ucho może usłyszeć. Emisja zorzowa pojawia się tak wysoko w atmosferze (Powyżej 50 mili/ 80 kilometrów) i powietrze jest tam tak cienkie, że jeżeli zorza mogła by produkować fale dźwiękowe, te dźwięki nigdy nie mogłyby dotrzeć na powierzchnie ziemi.
Geomagnetically induced currents is the space weather term used to describe electricity flowing through the ground during a geomagnetic storm. Changing magnetic fields cause currents to flow in wires and other conductors. When the local magnetic field begins to vibrate, electricity begins to flow. Geomagnetically induced currents can cause voltage fluctuations in electrical grids and damage high-voltage power transmission transformers. This can in extreme cases cause an interruption of power supply. Long pipe lines are also susceptible. Geomagnetically induced currents can increase the rate of corrosion which reduces the service life of a pipeline.

Inne pytania

Ziemia ma około 24 stref czasowych. Mówimy "około" dlatego, że niektóre kraje lub regiony używają czasu lokalnego zbaczającego o pół godziny od tych stref czasowych. Jednakże, kiedy mówimy o pogodzie kosmicznej lub o nauce ogólnej obchodzi nas jedna strefa czasowa Koordynowany czas uniwersalny (UTC). Znajdziesz ten czas wszędzie na naszej stronie. Urzyj mapy poniżej by zobaczyć różnice pomiędzy strefą czasową UTC i strefą czasową w której ty się znajdujesz. Kliknij na obrazek by ujrzeć powiększoną wersję.

Strefy czasowe

Obraz: Standardowe strefy czasowe świata. Source: Wikimedia Commons.

Przyjrzyjmy się kilku przykładom: wyobraź sobie, że jesteś w Vancouver, Kanada w Pacyficznej strefie czasu standardowego. Według czasu UTC to jest UTC 21. By przekształcić czas UTC do twojego czasu lokalnego musisz odjąć 8 godzin od czasu UTC. 21 odjąć 8 się równa czasu lokalnego 13 PST. Podczas czasu letniego (Pacific Daylight Time) Odejmujemy 7 godzin od czasu UTC i to równa się czasu lokalnemu 14 PDT.

Let's try again but this time we are in Amsterdam, the Netherlands. To convert 21 UTC to our local time we add 1 hour and that results in a local time of 22h. During daylight saving time we add 2 hours and that results in a local time of 23h.

Do keep in mind the date when converting UTC to your local time. We once again take Vancouver, Canada as an example: it currently is 14 November, 02h UTC time. This results in 18h on 13 November local time in Vancouver, Canada.

SpaceWeatherLive does offer a way to change the UTC time to your local time on the interactive graphs like the solar wind and solar flare graphs. You do this by tapping on the clock which you can find both on the website and app. This will change the times displayed on the interactive graphs to your local time or back from your local time to the UTC time.

No. You might come across people out there who claim that the Sun is responsible for seismic and volcanic activity here on Earth but there is absolutely no scientific evidence that space weather and volcanic activity/earthquakes are related in any way. Dr. Keith Strong made this excellent video on his YouTube channel which is where he comes to exactly this conclusion.

Informacje o SpaceWeatherLive

All the data and information that we publish on SpaceWeatherLive can not be downloaded directly from our website. All of the information that we publish come from external sources that are freely accessible for everybody. If you are interested in certain data that we provide on SpaceWeatherLive we advise you to download it directly from the original source. The data on our website is always accompanied by a footnote that indicates from which website or institution the data came from. We also have a special page with handy links where we have a list of websites, many of which we use to get the data that we display on our website.
Yes. We have an app available for iOS and Android that brings you the familiar SpaceWeatherLive experience to your mobile device. The app has an integrated push notifications service, an app exclusive dark theme and is free to use for anybody. There are no (hidden) costs!
SpaceWeatherLive does offer a way to change the UTC time to your local time on the interactive graphs like the solar wind and solar flare graphs. You do this by tapping on the clock which you can find both on the website and app. This will change the times displayed on the interactive graphs to your local time or back from your local time to the UTC time.

Aplikacja SpaceWeatherLive

You can get rid of the ads in the SpaceWeatherLive app by going to the menu, press settings and press remove ads. This will bring you to a page where you can remove the ads by purchasing a subscription for 1 month, 6 months or 1 year. This will remove all the ads in your Android or iOS SpaceWeatherLive app for the time period you have chosen and support SpaceWeatherLive along the way!

Strona SpaceWeatherLive

It is at the moment not possible to get rid of ads on the main website.

Forum społecznościowe SpaceWeatherLive

A subscription to remove ads can also be purchased on our community forum for an ad free experience there. This will also provide your account with unlimited storage for attachments and access to the forums whenever they are offline due to maintenance or other unforeseen circumstances.
We understand that we send out a lot of notifications during periods with a lot of solar and geomagnetic activity but you can choose exactly which notifications you want to receive by going to the menu in the SpaceWeatherLive app. Press settings and press manage push alerts. This will bring you to a page where you can select or deselect the notifications that you want or do not want to receive. There is also a page there with frequently asked questions where you can find additional information.

Najnowsze wiadomości

Wesprzyj SpaceWeatherLive.com!

Wielu ludzi odwiedza SpaceWeatherLive aby śledzić aktywność słoneczną lub sprawdzić czy jest szansa na zaobserwowanie zorzy polarnej. Niestety, większy ruch na stronie oznacza większe koszty utrzymania serwera. Dlatego, jeśli jesteś zadowolony ze strony SpaceWeatherLive, zachęcamy do wspierania nas finansowo. Dzięki temu będziemy mogli utrzymać naszą stronę.

100%
Wesprzyj SpaceWeatherLive naszymi produktami
Sprawdź nasze produkty

Fakty na temat pogody kosmicznej

Ostatnie rozbłyski klasy X2024/09/14X4.54
Ostatnie rozbłyski klasy M2024/09/14M3.0
Ostatnia burza geomagnetyczna2024/09/17Kp8- (G4)
Dni bez plam słonecznych
Ostatni dzień bez skazy2022/06/08
Średnia miesięczna liczba plam słonecznych
sierpnia 2024215.5 +19
września 2024154.3 -61.2
Ostatnie 30 dni161.6 -51.3

Ten dzień w przeszłości*

Rozbłyski słoneczne
12000M7.33
22023M4.0
32004M2.82
42023M1.8
51999M1.38
DstG
11989-255G4
22023-85G2
32000-77G2
41977-76G2
51984-73G2
*od 1994

Sieci społeczne