Let's compare! Halloween 2003 VS May 2024 Solar Storms!
vrijdag 17 mei 2024 18:33 UTC
Today we have a really special news item for you! We have a guest post made by Christian Harris from Space Weather Trackers. Christian is a friend of the website an has made very well received guest posts before. He has some serious big brain knowledge about everything space weather related. I am sure many of you have heard of him before. He is here to shed some light on the Extreme G5 geomagnetic storm of last weekend and the famous Halloween 2003 solar storms. Please read his article below and gain some fascinating insights on two of the strongest solar storms in modern times. It is well worth the read! If you are interested in Christian's work be sure to follow him on Facebook and follow his Space Weather Trackers Facebook page. Christian, the stage is yours:
What. A. Month.
Last week certainly kept us space weather monitors busy! With X-class flares, coronal mass ejections (CMEs), global aurora, and history in the making, it was hard to catch our breath! I thought it would be fun to summarize and compare last weekend’s geomagnetic storm with the Halloween storms of 2003, another top show in recent history.
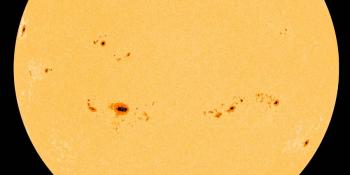
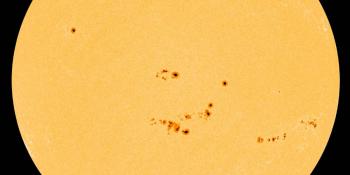
So first off, the sunspot groups! The first two photos below are of the two sunspot regions responsible for the two sets of storms we're comparing: AR3664 from last weekend’s storm, and AR0486 for the Halloween 2003 storms. On top of their white light images, I've overlayed their magnetic structure so the complexity of the groups can be properly appreciated.
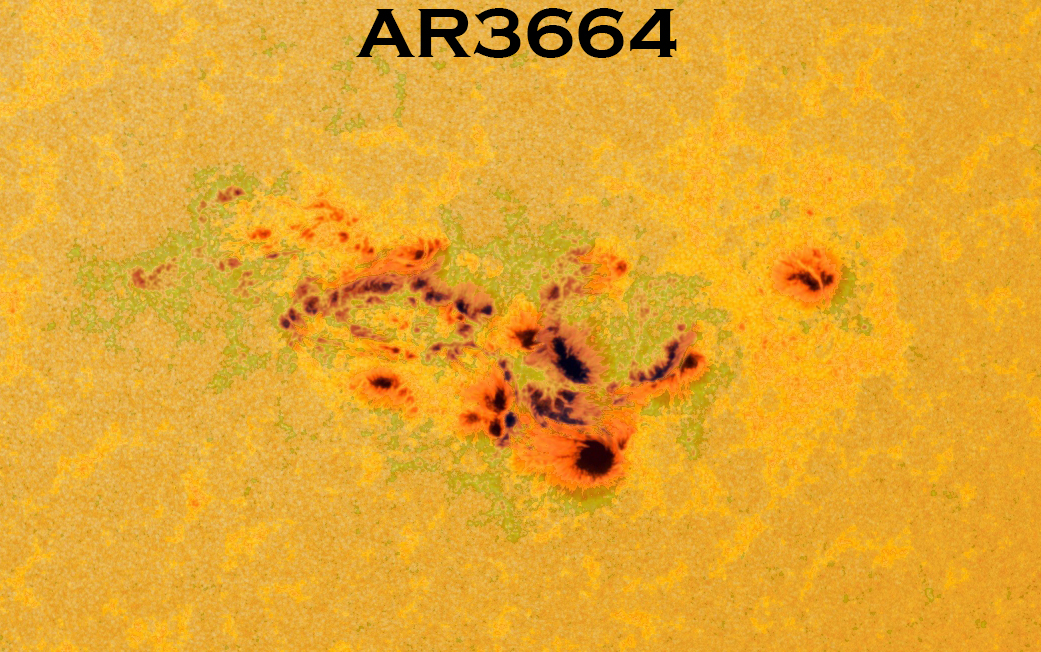
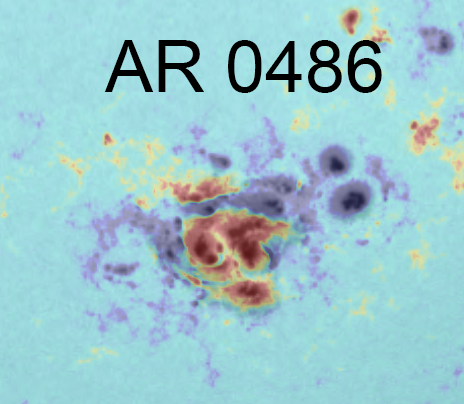
Both regions pummeled Earth with multiple X-class flares through the rotations, though AR0486 pumped out some much bigger numbers, including the legendary ~X45 flare as it was rotating across the western limb. AR3664 put out lower numbers, with its largest recorded flare coming in at X8.7 as it was rotating over the western limb. However, this group was much more CME heavy, with one every 6-12 hours for several days! This is what created the potential for the geomagnetic storms last weekend, compared to the super powerful, yet fewer, CMEs that AR0486 released in 2003. All in all, AR3664 put out 12 X-class flares during its rotation across the solar disc, whereas AR0486 put out 10.
The next two photos are the solar wind stats for each of the respective storms, with their maximum values listed.
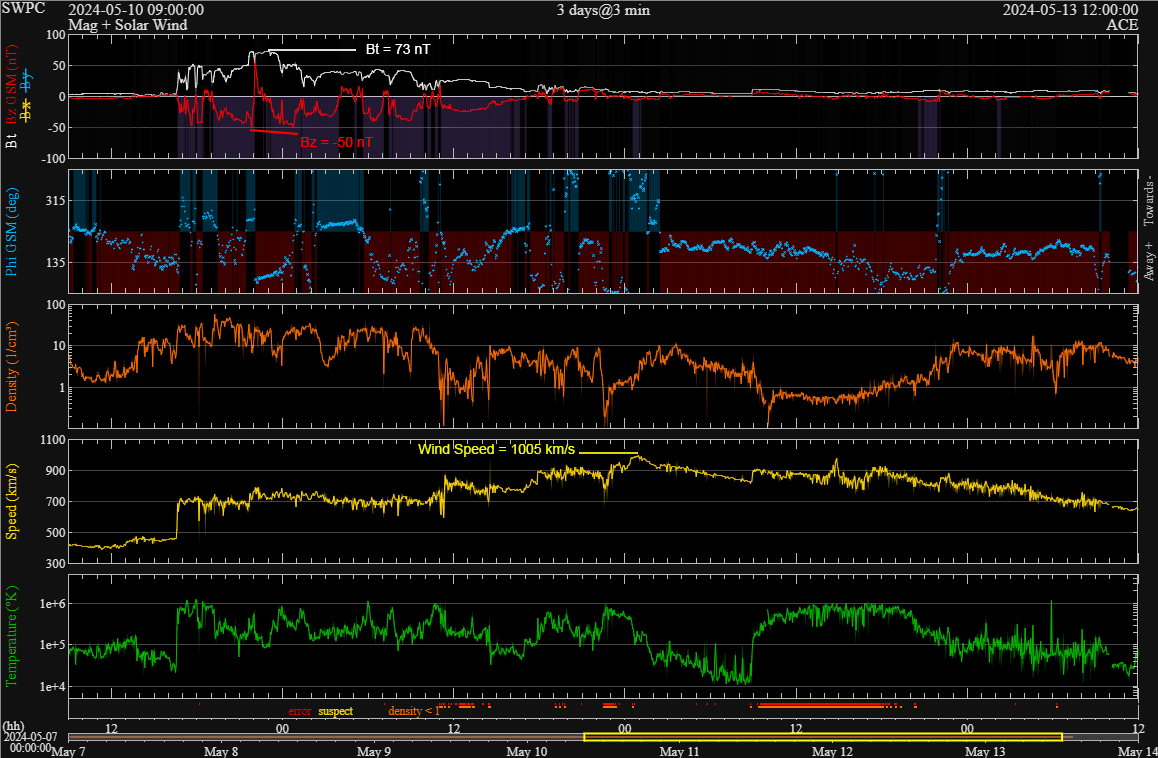
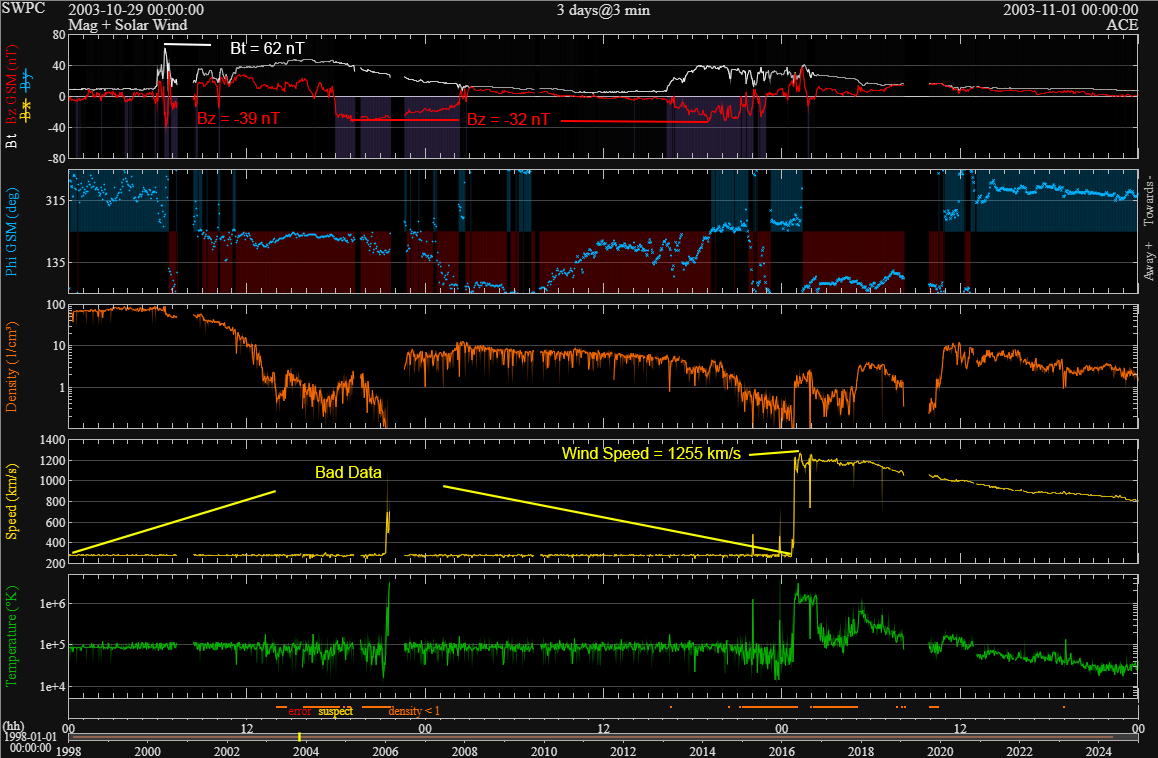
When looking at last weekend’s data, note that the total magnetic field strength from the arrival of the first CME (which was likely at least CME# 1-3 put together) peaked at 73 nT! This exceeded the peaks of the Halloween 2003 storms, which hit a maximum value of 62 nT. Additionally, the minimum value of Bz during last weekend’s storms was far more potent than the Halloween 2003 storm! Last weekend ,a Bz value of -30 nT to – 50 nT was maintained for multiple hours, whereas the Halloween 2003 storm had two shorter negative Bz periods, with values around -32 nT for the time.
Both sets of storms registered some pretty fast speed as well! Solar wind speed data peaked at 1005 km/s for last weekend’s storm, whereas a little investigation had to go in to determining peak speeds for the 2003 display due to ACE data needing reconstructed for the time period. A study done by Skoug et al. (2004) revealed solar wind speeds likely exceeded 1850 km/s during the times data was missing, and was a large part in why the geomagnetic storm’s strength was so great.
This brings us to our Dst index. I’ve mentioned this before, but the Dst index is the one I prefer to use to gauge the total strength of a geomagnetic storm, as it gives a better quantitative value than simply looking at the Kp index. The photo below is the recorded Dst values from this month so far.
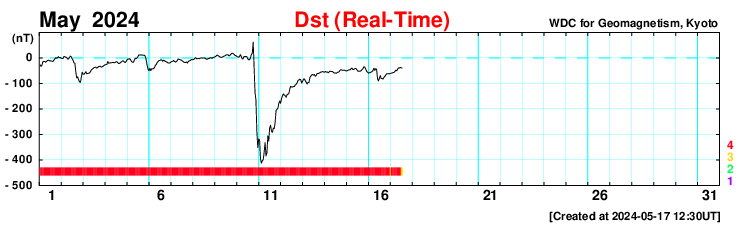
The Dst index hit a minimum of -412 nT early morning UTC time on the 11th. When compared with the Dst index for October 2003, seen in the next photo…
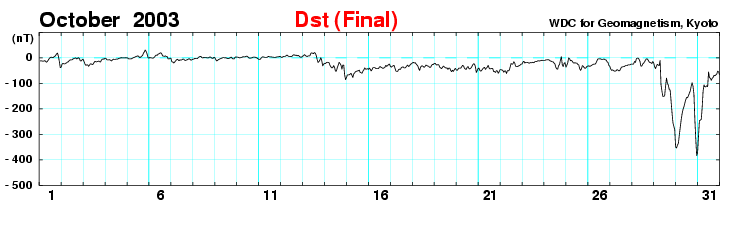
We see that the Halloween 2003 storm had two large minimums: the first at -353 nT and the second at -383 nT.
This means that last weekend’s storm was stronger than the legendary Halloween storms of 2003 in nearly every area! This is consistent with aurora being seen, literally, all over the planet including the continental US and Hawaii! It would likely be easier to name the places that didn't see or photograph them over the places that did.
To show the strength of bigger geomagnetic storms from the past to find out how long it has been since we had one like this, I have included the Dst chart from November 2003 as well below.
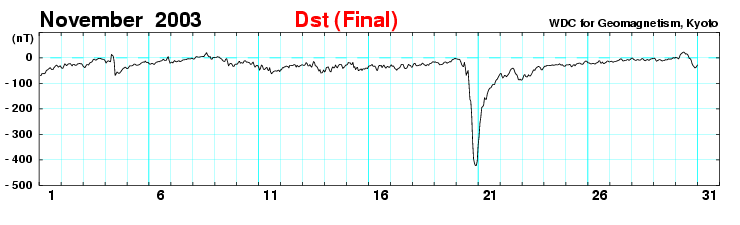
There was another superstorm during this time in which the Dst index reached a minimum of -422 nT, which was a little stronger than last weekend’s storm, though the November 2003 storm did not quite receive the same buzz that the Halloween 2003 storms did. This means the last time we had a show of this magnitude was 20.5 years ago!
The last 4 photos are of the Aurora Electrojet index over the last 4 days which reflect the aurora activity during each day.
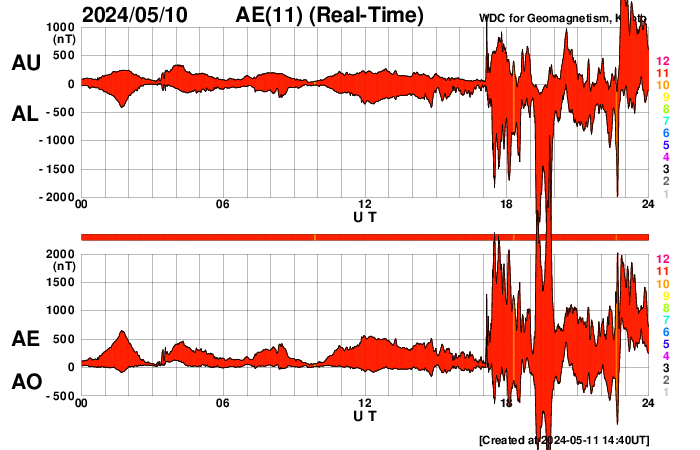
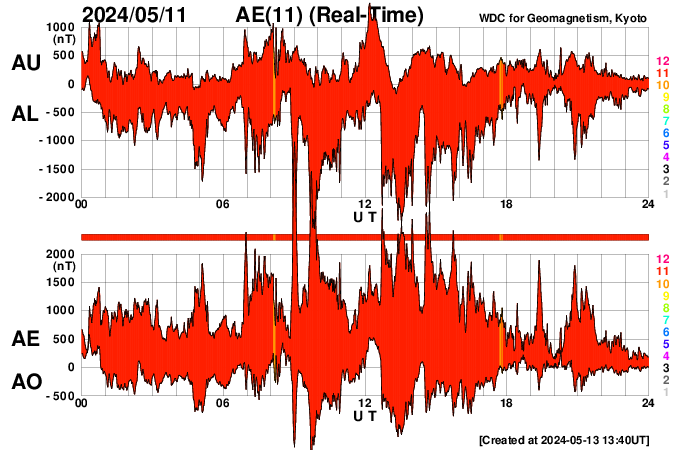
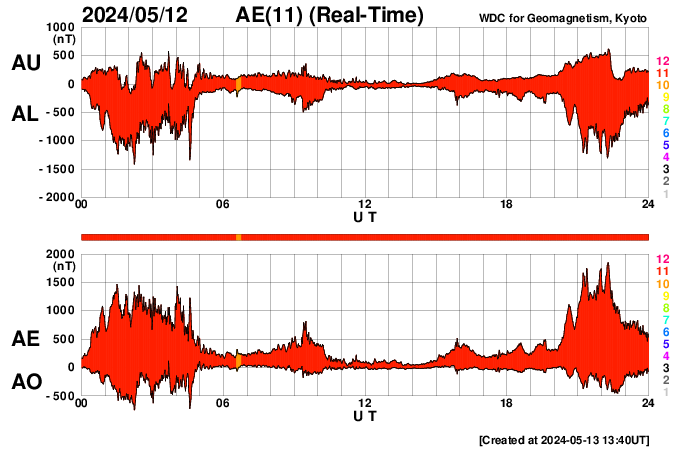
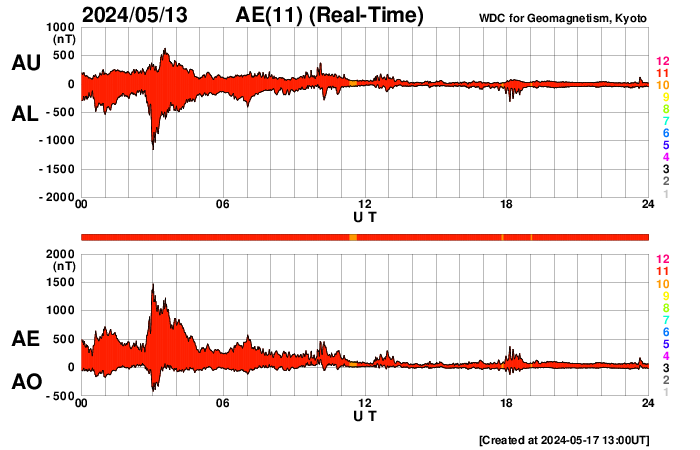
After the show began late on May 10th, the AE index was literally off the charts, showing the equatorward extent of the aurora throughout the last few days, which did not come back to quiet values consistently until late on the 13th.
AR3664 has completed rotation over the western limb now, but we will see if it survives the journey across the backside of the sun in a few weeks.
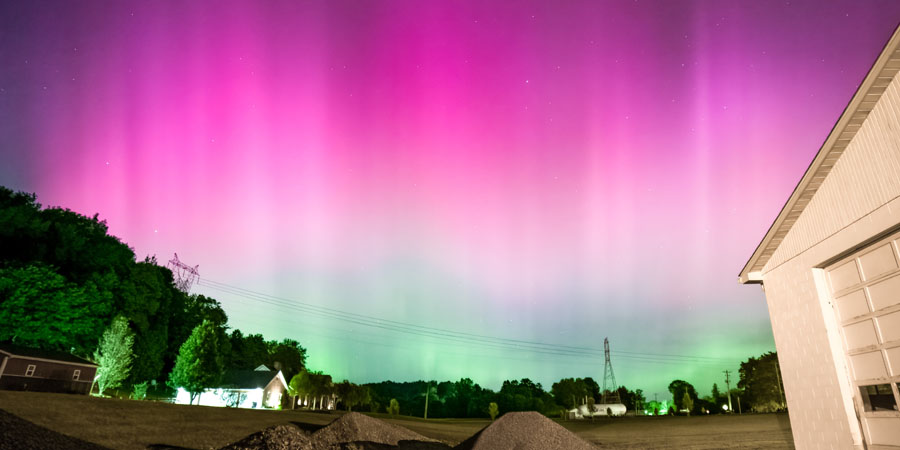
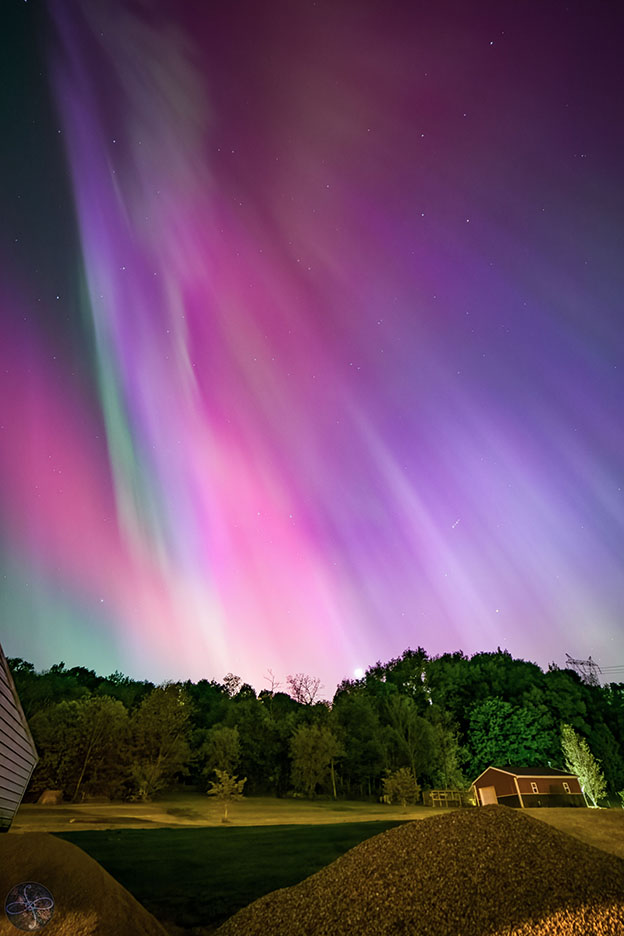
The last photo I want to include is my own personal aurora shot from here in the states! At latitude 40° N I had the aurora overhead and to my southern sky immediately as it started to get dark on the night of the 10th. Thankfully, I was set up and prepared, so I caught the best substorm I’ve seen in low latitudes before! Maybe we’ll get some luck and get one more opportunity like this for aurora. Cycle 25 certainly has been making up for the lesser activity of the prior cycle.
Thank you for reading this article! Did you have any trouble with the technical terms used in this article? Our help section is the place to be where you can find in-depth articles, a FAQ and a list with common abbreviations. Still puzzled? Just post on our forum where we will help you the best we can!
Laatste nieuws
Severe G4 geomagnetic storm
Solar maximum is here! G2 storm watch and X-flare!
G3 geomagnetic storm watch
Laatste forumberichten
Steun Poollicht.be!
Om ook bereikbaar te blijven bij grote poollichtkansen hebben we een zware server nodig die alle bezoekers aankan. Doneer en steun dit project zodat we online blijven en je geen enkele poollichtkans mist!
Ruimteweer feitjes
| Laatste X-klasse uitbarsting | 14/08/2024 | X1.1 |
| Laatste M-klasse uitbarsting | 07/09/2024 | M1.6 |
| Laatste geomagnetische storm | 28/08/2024 | Kp6- (G2) |
| Zonnevlekkenloze dagen | |
|---|---|
| Laatste zonnevlekkenloze dag | 08/06/2022 |
| Maandelijks gemiddeld zonnevlekkengetal | |
|---|---|
| augustus 2024 | 215.5 +19 |
| september 2024 | 165.8 -49.7 |
| Afgelopen 30 dagen | 185.9 -28.8 |