What is a filament?
Solar filaments are clouds of ionized gas above the solar surface squeezed between magnetic regions of opposite polarity. Being cooler and denser than the plasma underneath and their surroundings, they appear as dark lines when seen on the solar disk. When a solar filament is seen near the solar limb with the blackness of space as background it is called a “prominence” instead.

Image: A filament as seen by NASA’s Solar Dynamics Observatory which is suspended between two areas of opposite magnetic polarity.
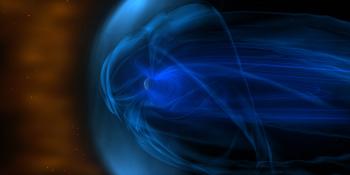
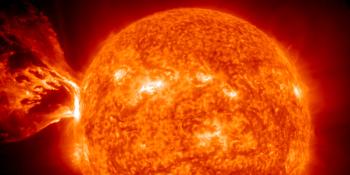
Solar filaments can last a long time before they disappear. Some survive for weeks! When solar filaments become unstable they can either fall back onto the Sun or erupt into space, sending a coronal mass ejection away from the Sun which can come towards Earth if the solar filament was well positioned. Just like coronal mass ejections produced by solar flares, a coronal mass ejection from a solar filament could also very well cause a geomagnetic storm on Earth. Space weather forecasters keep an eye on these filaments as they can be just as important as solar flares!

Image: A gorgeous filament eruption as seen by NASA’s Solar Dynamics Observatory.
Current data suggests there is a slight possibility for aurora to appear at the following high latitude regions in the near future
Gillam, MBLatest news
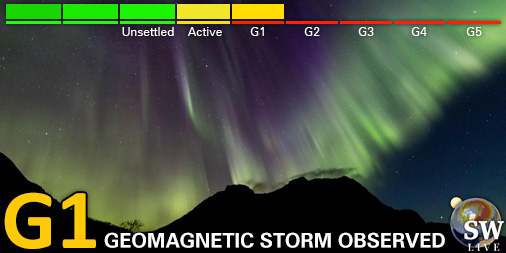
CME arrival, G3 storm watch
X1.1 solar flare
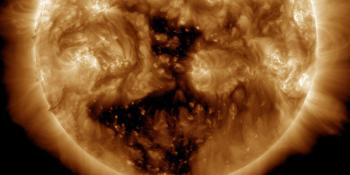
Coronal hole faces Earth
Latest forum messages
Support SpaceWeatherLive.com!
A lot of people come to SpaceWeatherLive to follow the Sun's activity or if there is aurora to be seen, but with more traffic comes higher server costs. Consider a donation if you enjoy SpaceWeatherLive so we can keep the website online!

Latest alerts
Monday, 5 May 2025
18:15 UTC - Geomagnetic activity
Minor G1 geomagnetic storm (Kp5) Threshold Reached: 17:59 UTC
06:15 UTC - Geomagnetic activity
Minor G1 geomagnetic storm (Kp5) Threshold Reached: 05:59 UTC

Sunday, 4 May 2025
15:09 UTC - Hemispheric Power Index
The OVATION model predicts the Hemispheric Power Index to reach 50GW at 15:48 UTC
08:00 UTC - Geomagnetic activity
Minor G1 geomagnetic storm (Kp5) Threshold Reached: 07:52 UTC
Space weather facts
| Last X-flare | 2025/03/28 | X1.1 |
| Last M-flare | 2025/04/30 | M2.03 |
| Last geomagnetic storm | 2025/05/03 | Kp5 (G1) |
| Spotless days | |
|---|---|
| Last spotless day | 2022/06/08 |
| Monthly mean Sunspot Number | |
|---|---|
| April 2025 | 140.6 +6.4 |
| May 2025 | 74.8 -65.8 |
| Last 30 days | 110.5 -21.4 |